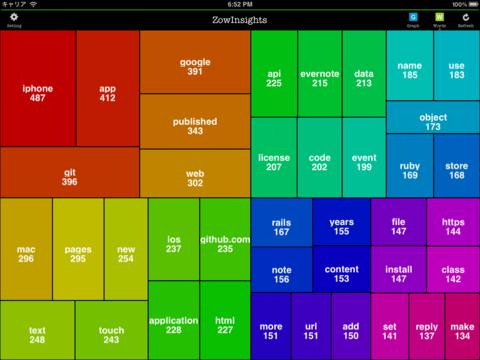
Try analyzing your notes registered on Evernote and displaying them as an attractive graph.
By turning them into a graph, you may notice things you had not seen before.
By graphing the frequency of appearance of the vocabulary in your notes (English only), you can understand your preferences and which words you use most frequently.
[Graph Function]
- Number of notes created/updated
- Number of notes per notebook
- Number of notes per tag
- Ratio of applications used to create notes
- Frequency of vocabulary appearing in notes (English only)
[Requirements]
An Evernote account is required to use ZowInsights.

